The Arterial Stiffness Report
 The Max Pulse Test generates one report for arterial stiffness and another report showing patient stress levels. Max Pulse Test reports can be printed or saved to PDF.
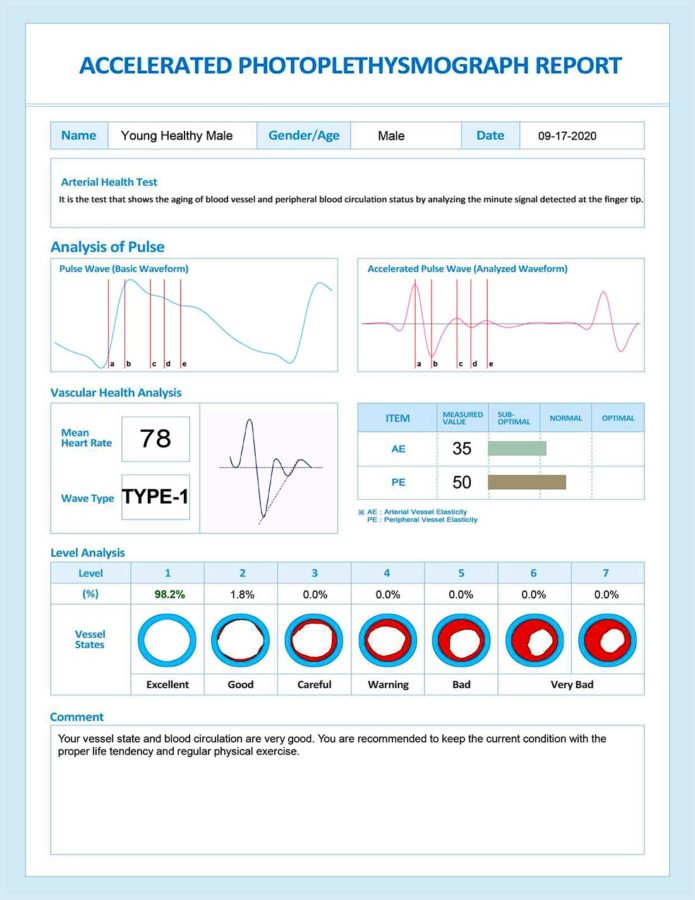
The following report is generated by the Max Pulse to show arterial aging.
Analysis of Pulse Section
The first graph (left side of the report) shows the arterial pulse wave as the heart moves through systolic and diastolic. The amount of blood in the finger tip increases, then begins to decrease. There is a “bump” in the graph as the aortic valve closes and the diastolic completed.
The second graph (right side of the report) shows the same graph that has been mathematically accelerated. This graph is very sensitive and this is what the software analyzes to score the patients arterial hardness.
Vascular Health Analysis Section
Here the report shows Mean Heart Rate and then the most important metric – Wave type.
This “wave type” refers to the accelerated pulse wave mentioned above.
This accelerated pulse wave was found to fall into 7 distinct types which are numbered 1 to 7 with 1 being a healthy heart and 7 being a heart and vascular system in the poorest condition.
Then there are 3 metrics which have a bar graph to show if they are in range or not.
AE = Artery Elasticity: Represents the elasticity of the wall of the large arteries by the contraction power from the heart.
PE = Peripheral Elasticity: Represents the elasticity of the small arteries at the periphery of the body.
Level Analysis: This shows what percentage of the total heartbeats fell into which wave type. This gives a more in depth look. The report shown has almost all heartbeats as type 1 – a close to perfect score.
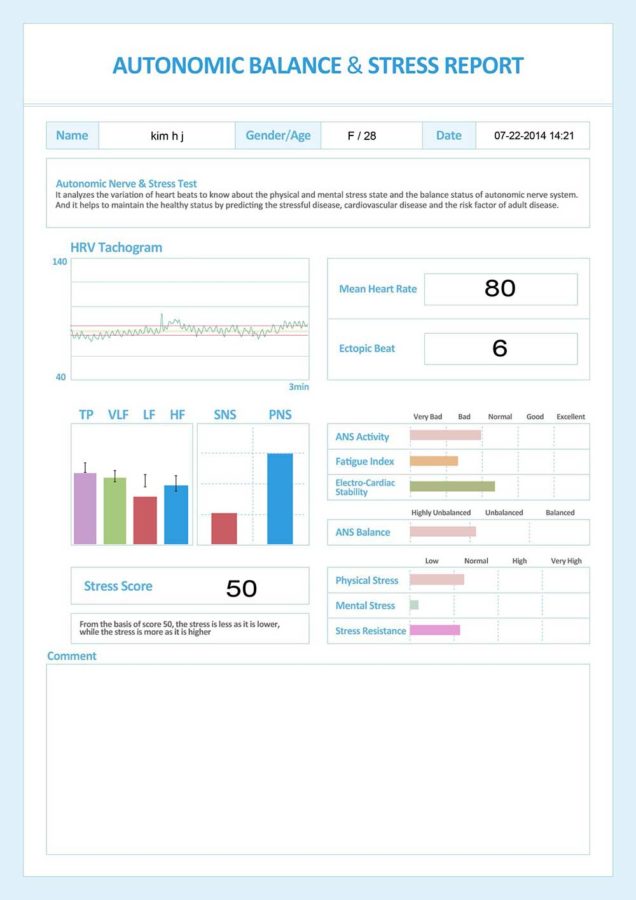
The Max Pulse Autonomic Balance and Stress Report
(The Max Pulse Test measures Heart Rate Variability and gives an analysis)
The HRV tachogram shows each heartbeat during the test period. To the right you will see mean heart rate and the number of ectopic beats.
TP LVF LF HF Section (Total Power / Very Low Frequency / Low Frequency / High Frequency)
These bar graphs reflect levels of Sympathetic and Parasympathetic activity and their balance.
Power in 4 frequency bands analyzed: Total Power / Very Low Frequency / Low Frequency / High Frequency
SNS PNS Bar Graphs
SNS/PNS Balance – SNS (sympathetic nervous system) & PNS (parasympathetic) Balance. SNS and PNS ratio is normal at around 6:4.
Higher SNS can show up as nervous, anxiety, agitation, excitement, increasing blood pressure, headache, etc.
The Frequency Bars – TP (total power), VLF (very low frequency), LF (low frequency) and HF (high frequency).
These bars show non-optimum when they are low.
Reduced TP: Decreased ANS function, decrease in bodies regulatory ability and a decrease in the ability to cope with environmental change.
Reduction of VLF: Decrease in the bodies ability to regulate body temperature and hormone levels.
Reduction of LF: Loss of energy, fatigue, too little sleep, tiredness and lethargy.
Reduction of HF: Chronic stress, aging, reduced electrical stability of the heart.
There is more, that is covered in the training.
But it is worth mentioning the Stress Resistance Score – the last bar graph. The Max Pulse has this unique aspect of HRV where it shows stress/fatigue, but it also scores how well the person is holding up under their stress- a kind of “stress gas tank”. This is great to show people the importance of caring for themselves. People can go charging along with terrible HRV scores for quite a while and feel fine. But when the Stress Resistance (“stress gas tank”) runs out, you get sudden collapses that can be serious and take a long time to recover from. This one score is very important and can avert poor patient outcomes by giving the early warning that the person can probably feel – but is ignoring.
Contact us for a more detailed explanation of the Heart Rate Variability report or if you have any questions about the Max Pulse Reports and how they work. There is a lot of information delivered by these reports that is not covered on this page.
